Heatcast
See where people will look, before anyone visits.
Heatcast shows you where people are likely to look on a web page. You get an attention heatmap, the order they're likely to look in, and a full HTML report you can open in your browser and save as a PDF. No tracking script, no traffic needed, and the prediction happens on your computer.
What it shows you

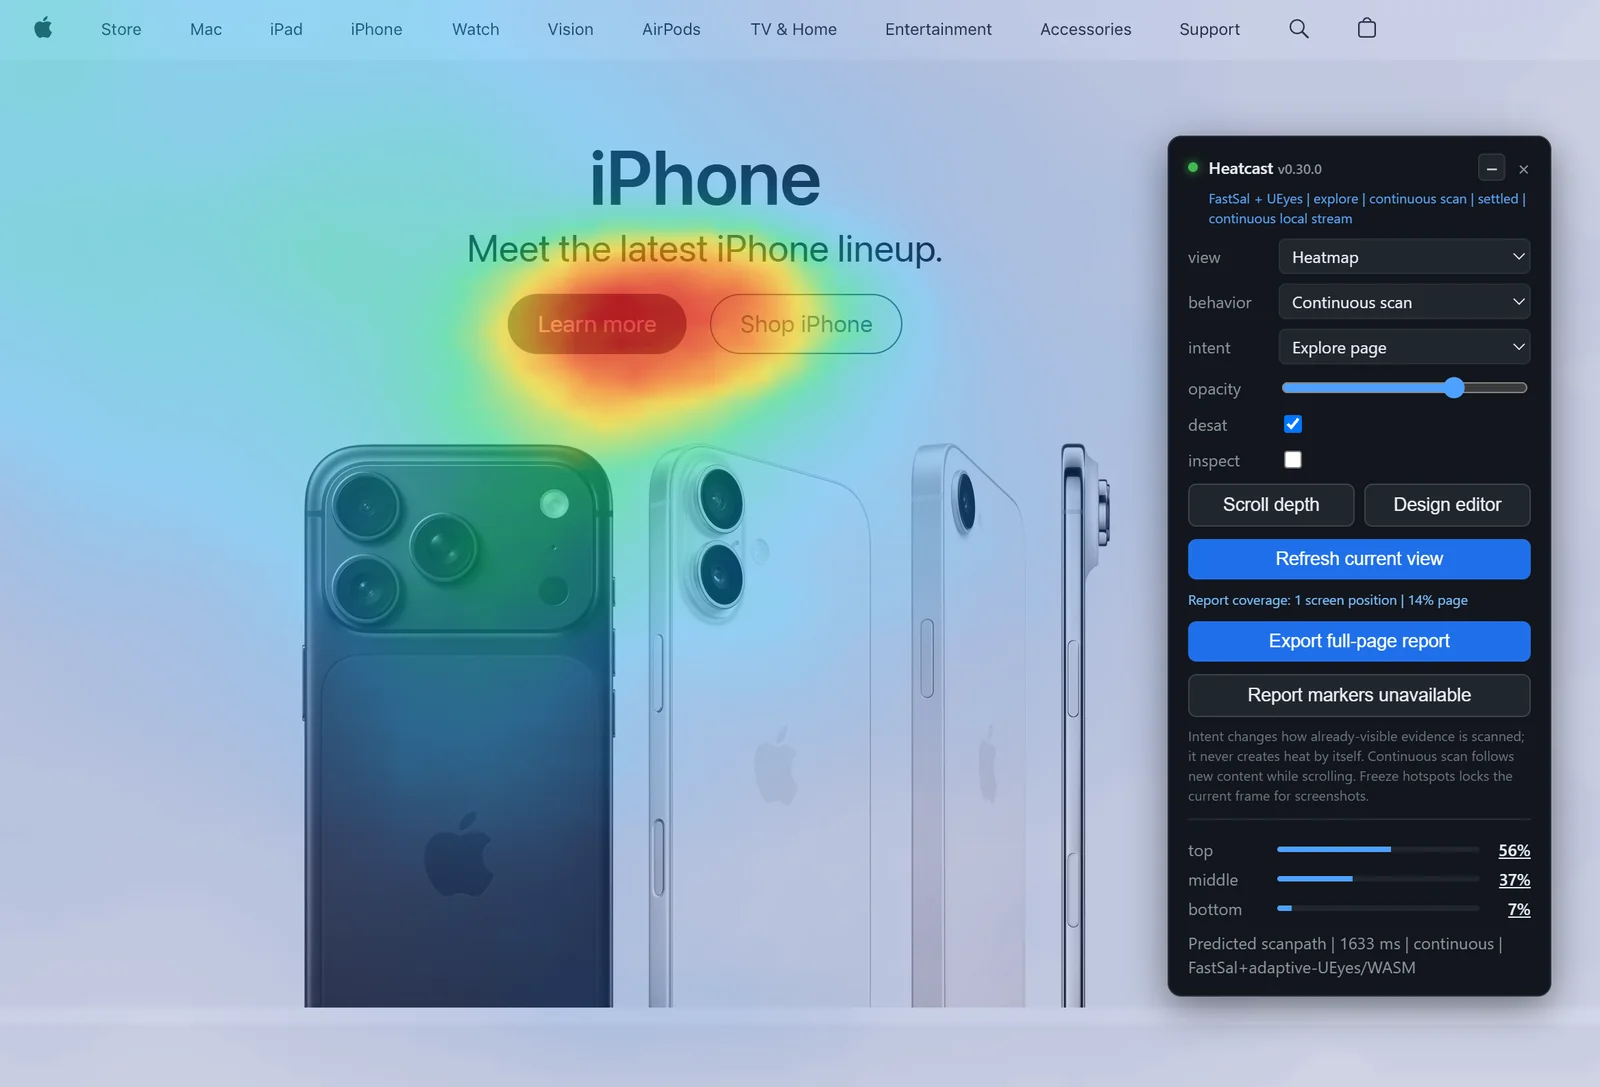
Attention heatmap
Warm means people are likely to look there. Cool means they are likely to skip it.
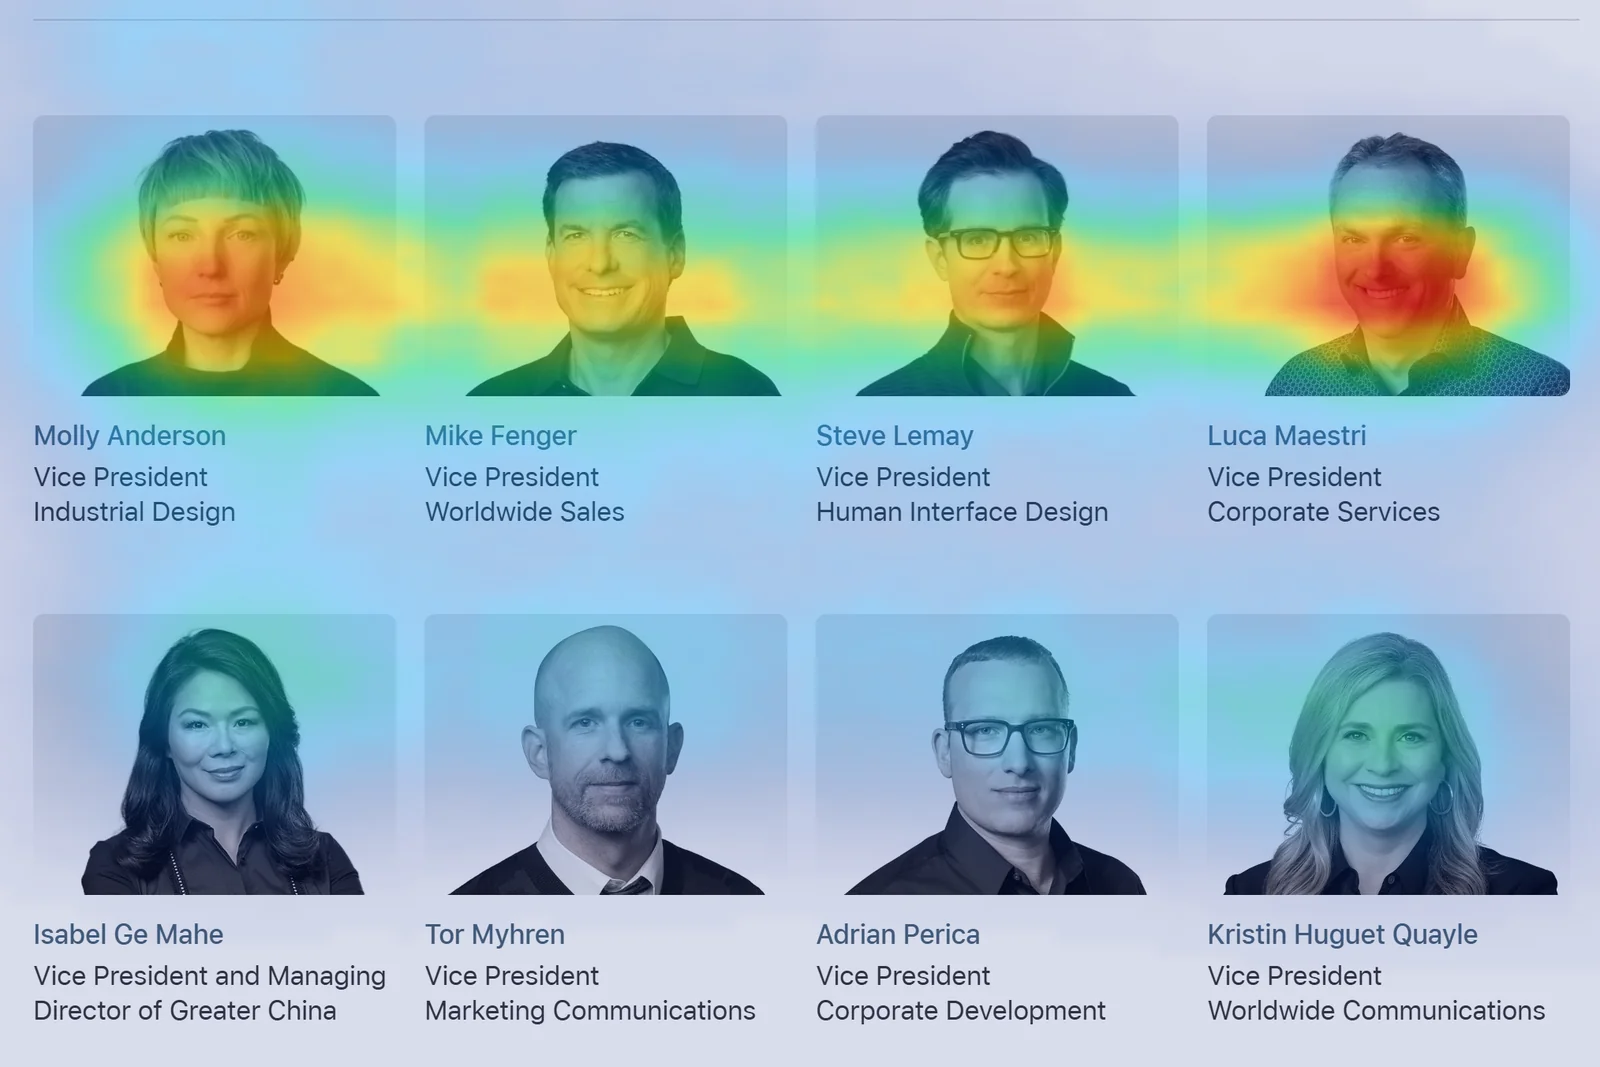
Predicted scanpath
The order people are likely to look in, not just how much. The scan keeps running while you scroll, so the picture updates.
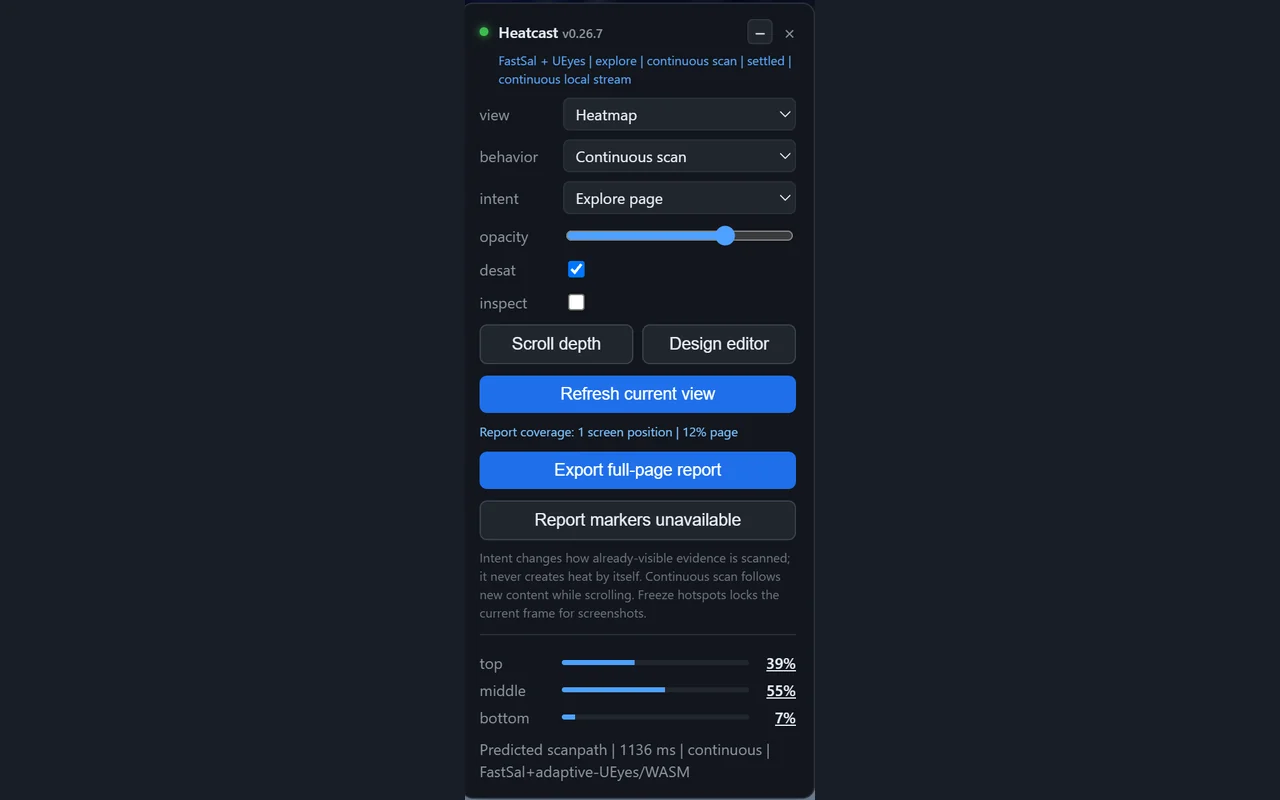
Scroll-depth analysis
How far down the page attention still holds up, and whether your call to action sits inside that range.
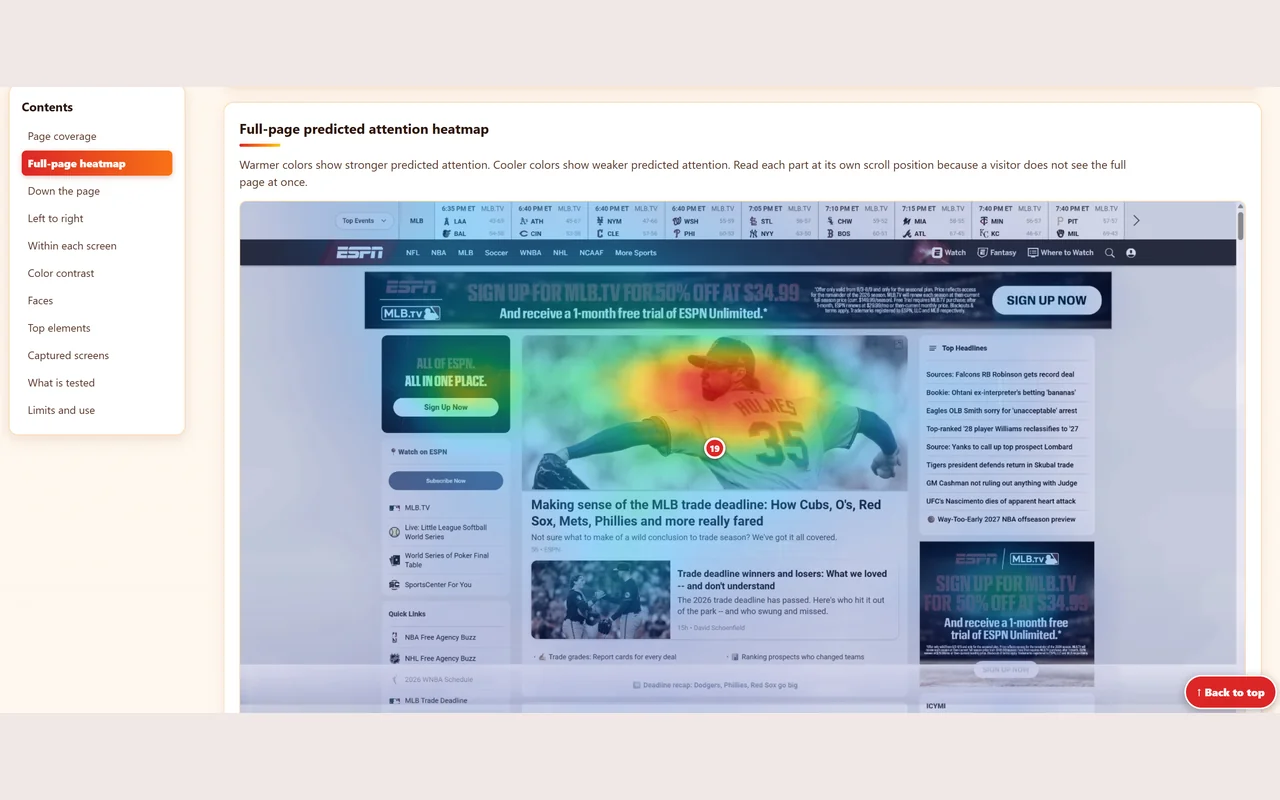
Full-page report
A stitched heatmap of the whole page, exported as an HTML file you open in your browser and can save as a PDF.
Inside the report
It exports an HTML file. Open it in your browser, print it to PDF if you need to send it on. It breaks the page down section by section and shows where every number came from.
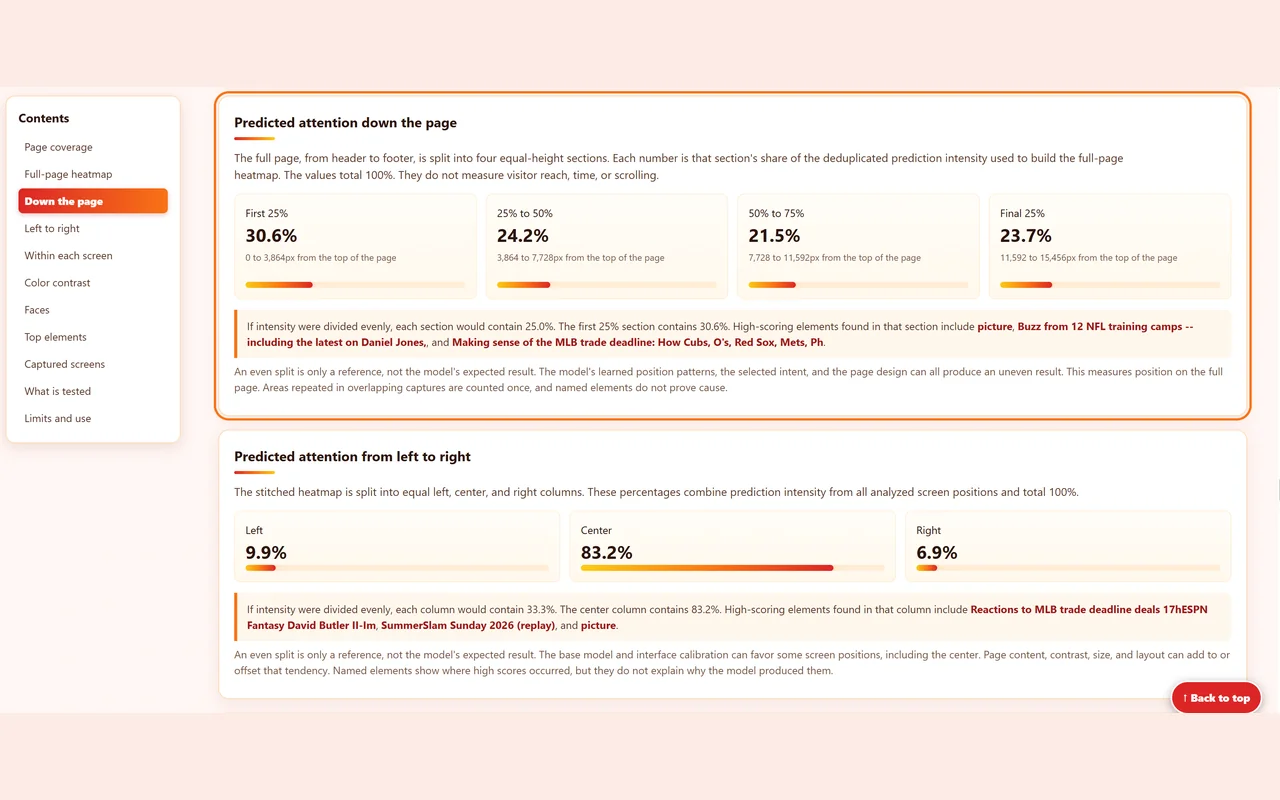
Down the page. The full page is split into four equal sections, each showing its share of the prediction. An even split would be 25% each, so you can see immediately whether the bottom half is being ignored.
Left to right. The same split across left, center and right columns, which is how you catch a sidebar quietly winning attention.
Top elements. The specific elements that scored highest, named. The report is careful to say that naming them does not prove they caused the score.
Contrast and faces. Color contrast across the page, and where faces were detected, since both change where the eye goes.
What is tested, and limits. A plain section on what the numbers do and do not mean. They measure position on the page, not visitor reach, time, or scrolling.
When it beats waiting for data
Before you launch
A new page has no clicks to map. You find out whether the layout works three weeks later, after the traffic is already spent.
On sites you do not own
It only needs the rendered page, so you can run it on a competitor or on a prospect you have not signed.
On low-traffic pages
Service area pages and older posts will never produce a usable behavioral heatmap on their own. This gives you the same read on all of them.
Before you spend a test
If you have four candidate layouts and enough traffic to test one properly, this helps you pick which one is worth the test.
Your pages stay yours.
Most heatmap tools need a script on your site, real visitor traffic, and weeks of waiting. Heatcast doesn't, because it predicts instead of recording.
The model files ship inside the extension and run on your computer, so no page content is sent anywhere to build the prediction. Your screenshots and exported reports stay with you, and the analysis code is blocked from contacting outside servers.
So you can test a competitor's page, a draft nobody has seen, or a client's staging site without sending any of it to someone else. Full detail in the privacy policy.
How the prediction is built
Saliency model
FastSal builds the base heatmap from the rendered page. It is the same class of model used in academic attention research, and it has been tested against eye-tracking data it was never trained on.
Interface calibration
Saliency models are trained on photographs, and people do not look at a screen the way they look at a photo. A layer learned from the UEyes eye-tracking dataset corrects for how people actually read interfaces.
Attention sequencing
A behavioral layer turns the static heatmap into an order. Regions that were just looked at get held back, then become eligible again, which is how a scanpath forms.
What it doesn't do
It's not recorded eye tracking. No camera, and no visitor is ever watched. It's a good guess at where people will look, which is a different claim.
It doesn't read your analytics. The prediction comes from the page itself, not from visitor data, which is why it works on pages nobody has visited yet.
It won't predict conversions. Getting looked at and getting chosen are different things. A hot spot means noticed, not persuaded.
It doesn't identify anyone. Face detection counts anonymous shapes. No identity, emotion, age or demographics, and no face images are stored.
FAQ
Try it on your own page
Free, no account, runs on your own computer, and works on any page you can open in Chrome.