The Great Decoupling: Impressions Up, Clicks Down, and What Actually Fixes It
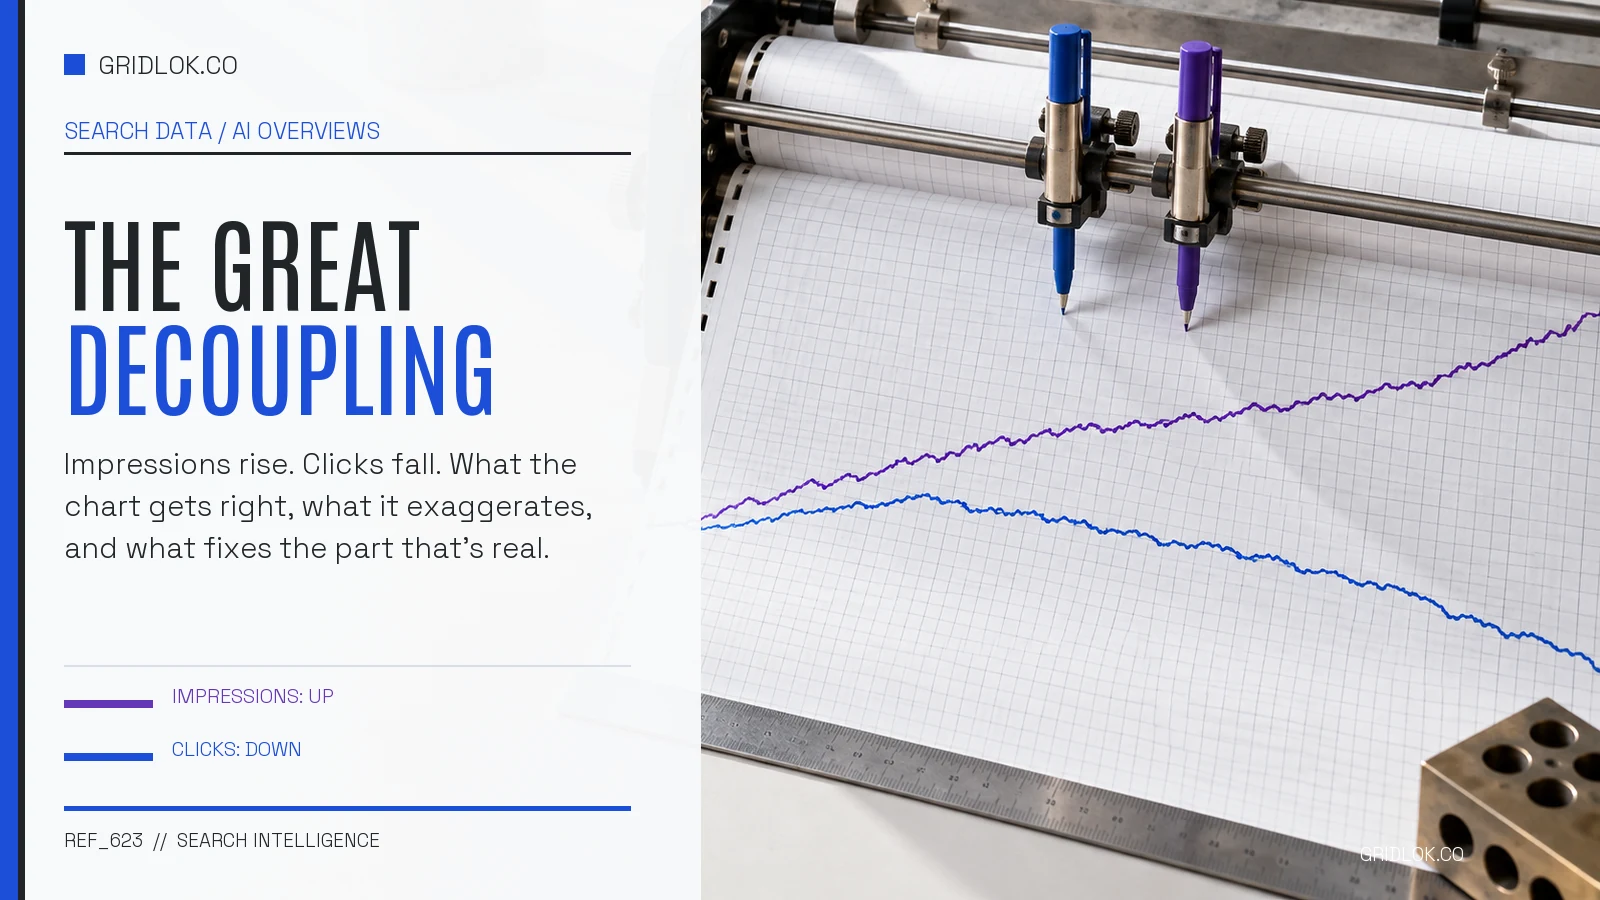
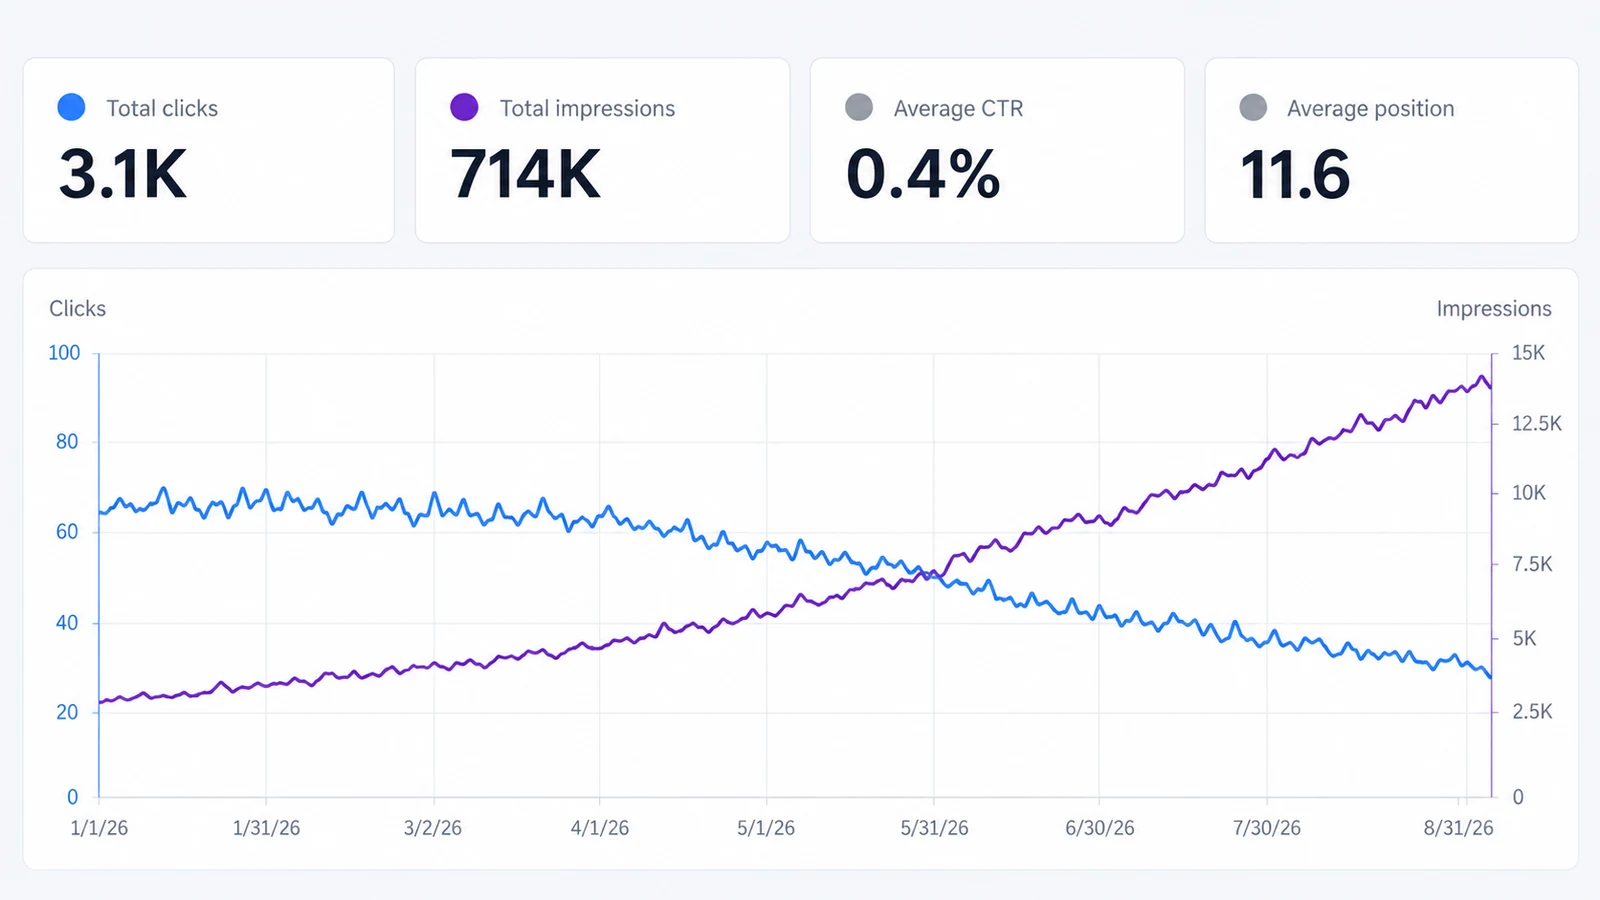
The Great Decoupling is the name the SEO world gave to a chart most of us have now seen in our own Search Console: impressions climbing, clicks flat or falling, and the gap between the two lines opening a little wider every month since AI Overviews arrived.
The name stuck because the chart is real. The explanation everyone reached for is only partly right.
I want to do two things here. Work out how much of your gap is AI Overviews, because a good chunk of it turned out to be bad measurement. Then lay out what fixes the part that’s real. That part has a fix, and it’s more specific than “build your brand.”
Key takeaways
- Search Console impressions were inflated for almost a year by a logging error Google has confirmed (May 13, 2025 until April 2026), and by rank-tracker bots that stopped counting when Google killed the 100-results page in September 2025. Check your gap against those dates before you blame AI.
- On queries where an AI Overview shows, organic click-through in Seer Interactive’s 53-brand study fell from 3.19% in January 2025 to 1.31% in December, then came back to 2.36% by February 2026. On queries without one, it rose to 3.82%.
- Being cited inside the AI Overview roughly doubles clicks per impression, about 20,700 per million against 9,400 for sites that rank but aren’t cited. On AI queries the fix is the citation, not the ranking.
- Google now reports AI impressions in Search Console but not AI clicks. The only click number you can fully trust is the one your analytics records after the visit.
What the Great Decoupling is, and who named it
Impressions and clicks used to move together. Rank higher, get seen more, get clicked more. From late 2024 the two lines came apart for a lot of sites: impressions kept rising while clicks stalled or dropped.
Darwin Santos put the phrase “the Great Decoupling” on it in a post on X on May 31, 2025. Barry Schwartz ran with it at Search Engine Roundtable three days later, and by mid 2025 it was the shorthand for the whole AI Overviews problem.
Google didn’t argue with it. At Search Central Live in Warsaw on June 16, 2025, Martin Splitt said that “if things are being shown in AI overviews, you will probably see less clicks,” and that impressions would likely go up while clicks “stagnate or fall a little bit.”
He added that the clicks you keep might convert better. When he was asked about the data behind that on LinkedIn afterward, he said it was an observation of his own. Google has repeated the quality-clicks line ever since without attaching a number to it.
The mechanism is simple enough. When your page is used as a source for an AI Overview, Search Console counts an impression every time that overview shows. The reader gets the answer at the top of the page and often stops there. You were seen, and you weren’t visited.
I covered the wider zero-click numbers in the post on zero-click searches. This is the same story told from inside one site’s reporting.
How much of your gap is real?
Less than the chart says. Four things happened to Search Console data between May 2025 and August 2026, and each one moved the impressions line without touching clicks. If you’re diagnosing a decoupling on your own site, you need all four dates on the chart.
| Date | What changed | Impressions | Clicks |
|---|---|---|---|
| May 13, 2025 | Search Console logging error begins (confirmed by Google, fixed from April 3, 2026) | Inflated for 11 months | Unaffected |
| June 2025 | AI Mode impressions counted inside the Search report, unsegmented | Up, with no way to separate them | Almost none from AI Mode |
| September 12, 2025 | Google removes the 100-results parameter rank trackers relied on | Bot impressions vanish, mostly desktop | Unaffected |
| August 31, 2026 | Generative AI performance report reaches every property | Now reported separately | Not reported |
May 13, 2025: the logging error
Google’s own data anomalies page carries this entry for April 3, 2026: “A logging error prevented Search Console from accurately reporting impressions from May 13, 2025.” Clicks weren’t affected. The fix rolled out over several weeks from early April 2026.
So for almost eleven months, the impressions line was too high and the click-through line was too low, on every property, by an amount Google hasn’t published. One agency analysis of 17 properties put the inflation at 30% to 50% on most of them.
Your number will differ. The point is that the decoupling chart everyone screenshotted in 2025 was drawn from inflated numbers.
June 2025: AI Mode folded in
When AI Mode launched, Google started counting its impressions inside the regular Search performance report with no way to separate them. An AI Mode answer that lists your page as a source is an impression. Almost nobody clicks out of AI Mode.
That’s a decoupling by design, and for a year it was invisible in the data.
September 12, 2025: the bots stopped counting
Google switched off the parameter that let a single page load show 100 results. Rank trackers had leaned on it for years, and every one of those loads registered an impression for every site in the top 100.
Brodie Clark’s analysis after the change found:
- 87.7% of 319 properties lost impressions.
- The median loss was about 15% across a larger set of sites.
- Desktop was hit far harder than mobile, which is where rank trackers run.
- Average position for pages ranking 21 and below jumped, because those pages were no longer “seen” by anything.
His question was the right one: if that many impressions were bots, how much of the decoupling was AI at all?
August 31, 2026: AI impressions get their own report
Search Console’s generative AI performance report launched on June 3, 2026 and reached every property on August 31. It shows impressions from AI Overviews, AI Mode, and the AI features in Discover, broken out by page, country, device, and date.
It shows no clicks and no queries. Google says more metrics will come, with no date. And the anomalies page already carries a logging error for this report, for August 13 to 17, so treat its first months as a sketch rather than a ledger.
The test I’d run before changing anything
- Open the Search performance report, set the date range to 16 months, and filter to mobile. The bots were on desktop, so the mobile line is the cleaner one.
- Mark May 13, 2025, September 12, 2025, and April 3, 2026 on it.
- If your impressions step down in September 2025 and again in April 2026 while clicks hold flat, a large share of your decoupling was never AI.
- Open the generative AI report and compare its impression count to your total. That ratio is the share of your visibility happening inside answers, and it’s the first number in this whole story that separates AI from everything else.
What survives that test is the real decoupling. For most content sites it’s still there. It’s just smaller and more concentrated than the 2025 chart suggested, and concentration is good news, because it means you can find it.
What the studies agree on, and what Google says back
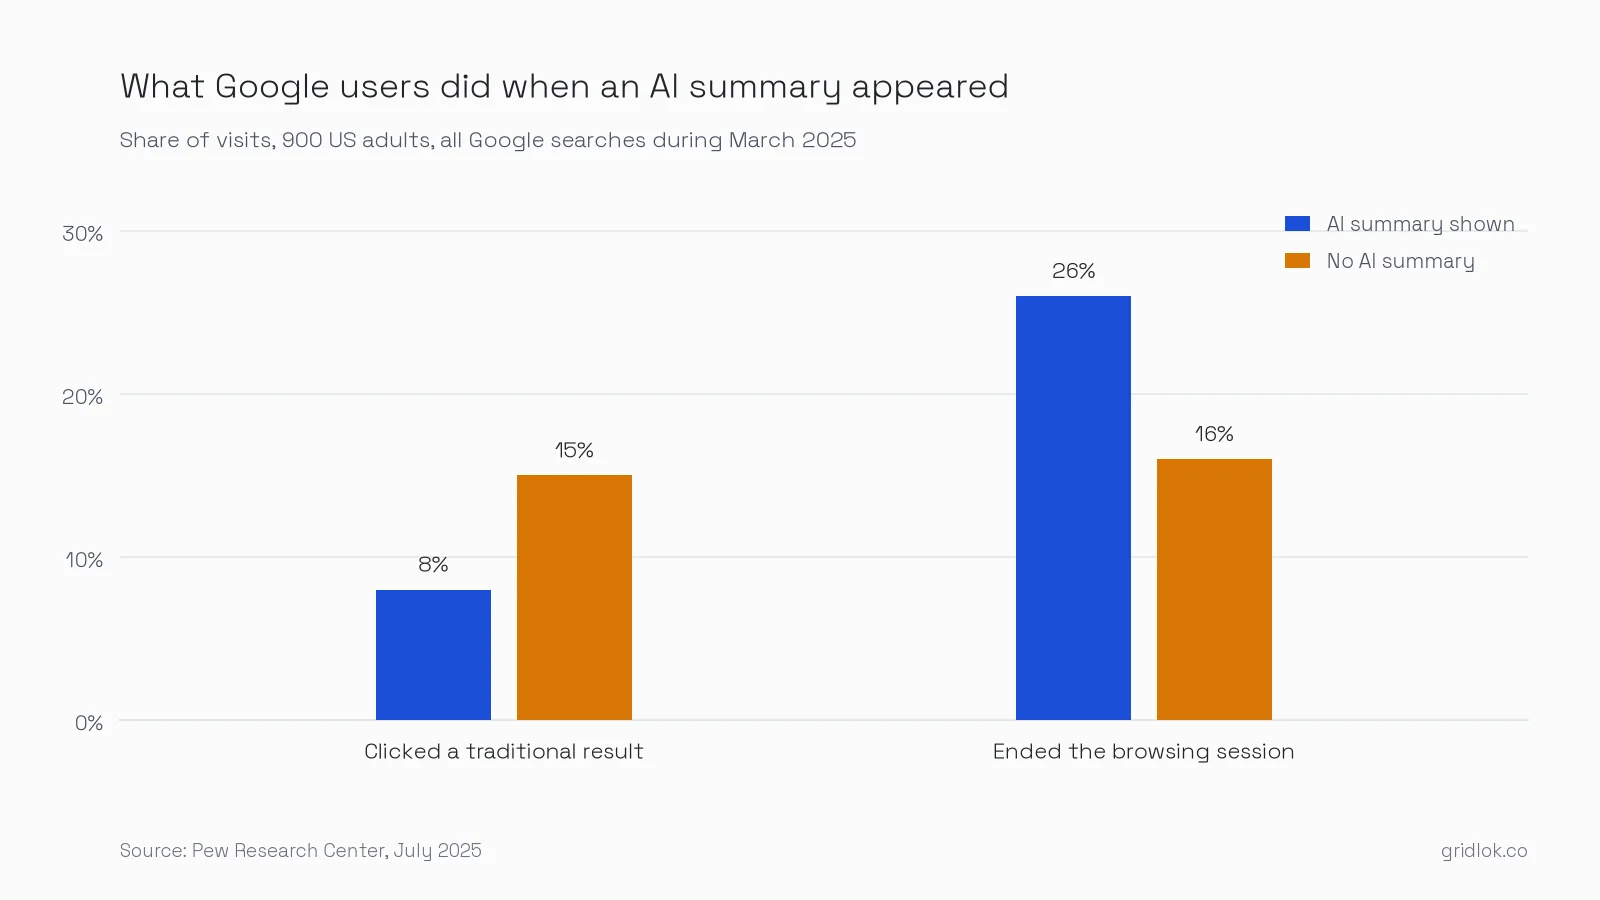
The independent studies point the same way. Pew Research watched 900 US adults search during March 2025.
When an AI summary appeared, people clicked a traditional result 8% of the time, against 15% when it didn’t. Only 1% clicked a link inside the summary itself. A quarter of visits with a summary ended the browsing session right there, against 16% without one.
Ahrefs compared Search Console click-through for 300,000 keywords before and after AI Overviews. In April 2025 the top result had lost 34.5% of its clicks on affected queries. Their December 2025 rerun put the loss at 58% for the top result, with position two losing about half and position ten losing nearly a fifth.
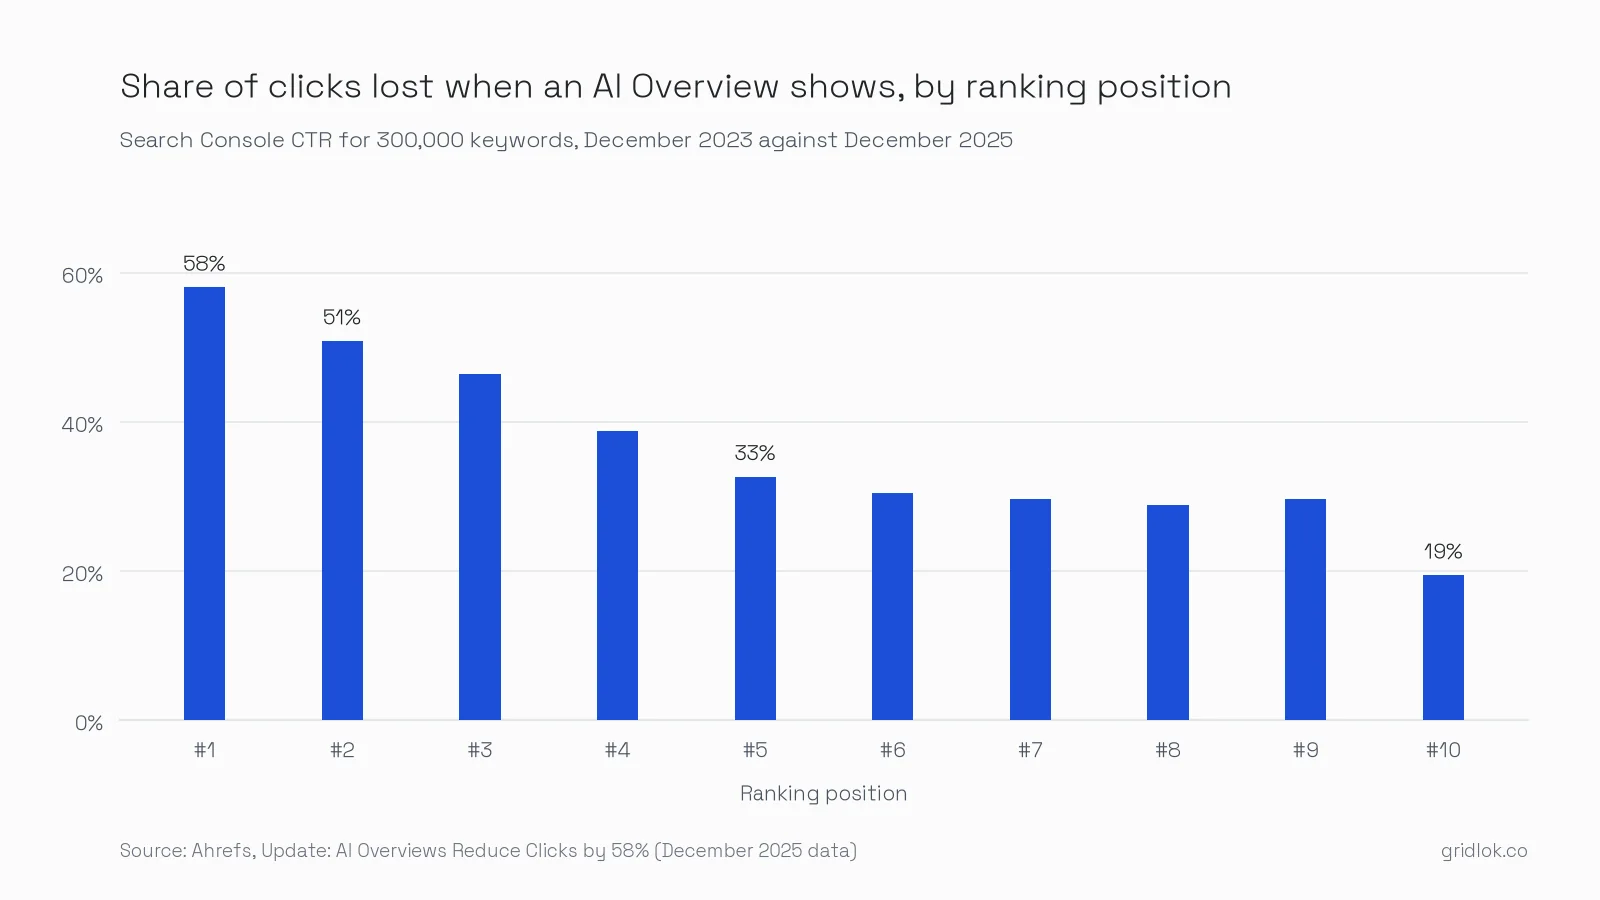
Ahrefs’ figures for every position. Each row is the share of clicks a page at that rank lost between December 2023 and December 2025 on the 150,000 keywords that now show an AI Overview, measured against what the same rank would have earned without one.
| Ranking position | Share of clicks lost when an AI Overview shows |
|---|---|
| #1 | 58.0% |
| #2 | 50.8% |
| #3 | 46.4% |
| #4 | 38.8% |
| #5 | 32.6% |
| #6 | 30.5% |
| #7 | 29.7% |
| #8 | 28.8% |
| #9 | 29.7% |
| #10 | 19.4% |
Seer Interactive tracked 53 brands, 5.47 million queries, and 2.43 billion organic impressions from January 2025 to February 2026.
On queries with an AI Overview, organic click-through went from 3.19% in January 2025 to a floor of 1.31% in December 2025. Then it climbed back to 2.36% by February 2026. On queries with no AI Overview it rose the whole time, from 2.75% to 3.82%.
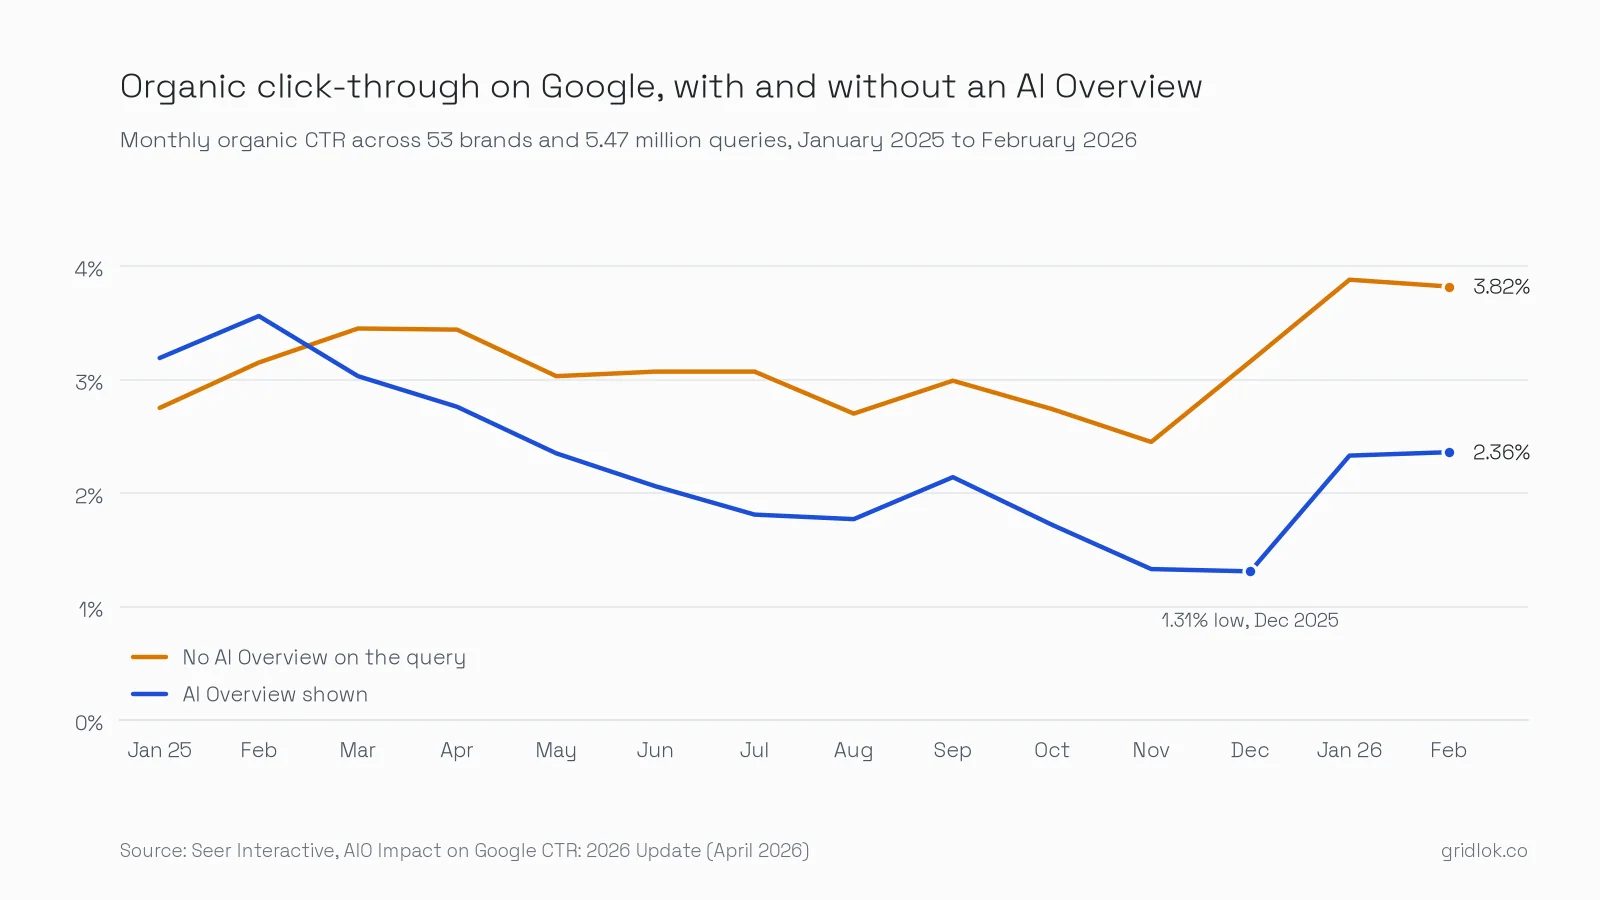
The numbers behind the chart, month by month. Each row is the organic click-through rate across the 53 brands’ Search Console data, averaged over their 5.47 million queries and split by whether the query showed an AI Overview that month. It’s a market average, not any one keyword, so your own pages will sit above or below it.
| Month | Organic CTR when the query showed an AI Overview | Organic CTR when it didn’t |
|---|---|---|
| January 2025 | 3.19% | 2.75% |
| February 2025 | 3.56% | 3.15% |
| March 2025 | 3.03% | 3.45% |
| April 2025 | 2.76% | 3.44% |
| May 2025 | 2.35% | 3.03% |
| June 2025 | 2.06% | 3.07% |
| July 2025 | 1.81% | 3.07% |
| August 2025 | 1.77% | 2.70% |
| September 2025 | 2.14% | 2.99% |
| October 2025 | 1.72% | 2.74% |
| November 2025 | 1.33% | 2.45% |
| December 2025 | 1.31% | 3.16% |
| January 2026 | 2.33% | 3.88% |
| February 2026 | 2.36% | 3.82% |
Seer calls the rebound a leveling off, and I’d read it the same way. Google adjusted how often and how large the overviews show, and the floor moved up a step.
The desktop clickstream data tells a matching story from the other side. In Datos’s Q2 2026 report, organic click-through on desktop Google fell from 46% in March to 40.7% in June, while zero-click share stayed flat and the share of clicks going to Google’s own properties hit 20.4%.
Fewer clicks reach independent sites, and the ones that leave the results page increasingly go somewhere Google owns.
Google’s reply, from Liz Reid in August 2025, is that “total organic click volume from Google Search to websites has been relatively stable year-over-year” and that the average click is now a quality click, meaning the user doesn’t bounce straight back. The AI features documentation says the same thing about clicks from pages with AI Overviews. No figures accompany either claim.
Both sides can be right at once. Total clicks across the whole web can hold steady while the informational pages that used to earn them lose theirs to a summary. Stable in aggregate is not stable for you.
The studies at a glance, so you can see how differently each one measured the same thing:
| Study | Method | Period | What it found |
|---|---|---|---|
| Pew Research Center | Browsing data from 900 US adults, 68,879 searches | March 2025 | Clicks on regular results 8% with an AI summary, 15% without. 1% clicked a link inside the summary. |
| Ahrefs | Search Console CTR for 300,000 keywords, half with AI Overviews | Dec 2023 vs Dec 2025 | Top result lost 58% of its clicks. Position 10 lost 19%. |
| Seer Interactive | 53 brands, 5.47 million queries, 2.43 billion impressions | Jan 2025 to Feb 2026 | Organic CTR on AI Overview queries: 3.19% to a 1.31% low, back to 2.36%. Cited brands earn about twice the clicks per impression of uncited ones. |
| Datos | Desktop clickstream panel | Q2 2026 | Organic CTR 46% to 40.7% in one quarter. Zero-click flat. Google-owned destinations took 20.4% of clicks. |
| Google (Liz Reid) | Internal data, no figures published | August 2025 | Total organic clicks described as relatively stable year over year, and the clicks as higher quality. |
The number that changes the plan
Seer also worked out what a million impressions turn into on informational queries, split three ways.
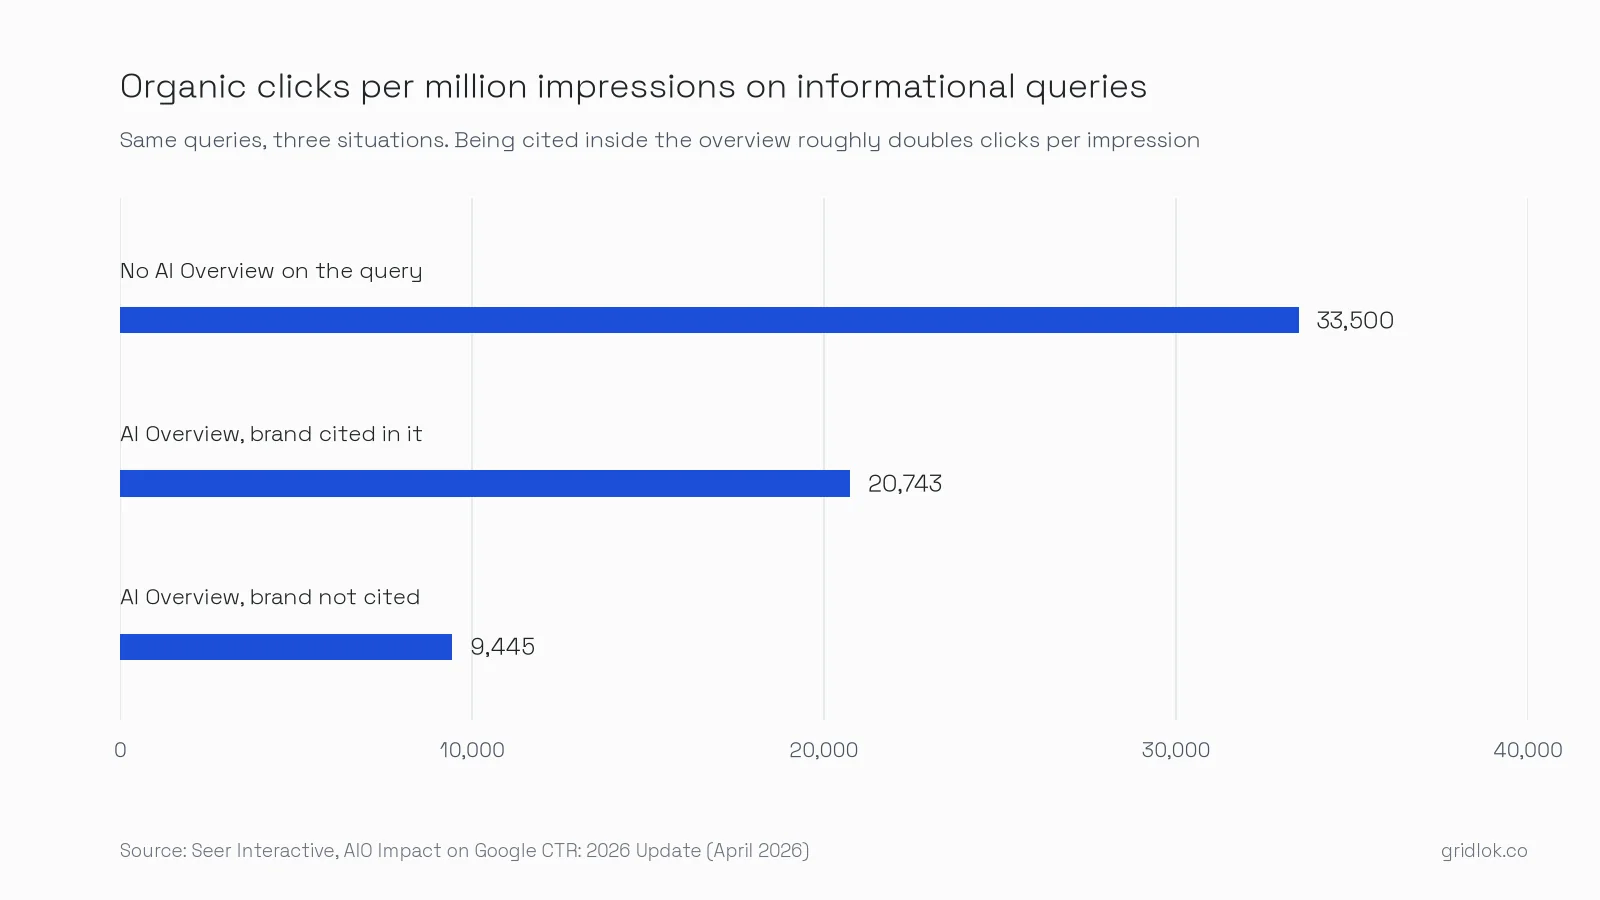
| Situation on the results page | Organic clicks per million impressions | Clicks per 100 times your page shows |
|---|---|---|
| No AI Overview | 33,500 | 3.4 |
| AI Overview, and your page is cited in it | 20,743 | 2.1 |
| AI Overview, and your page is not cited | 9,445 | 0.9 |
In plain terms: every 100 times your page appears, it earns about 3 clicks when there’s no overview, about 2 when there’s an overview that cites you, and less than 1 when there’s an overview that doesn’t. That last row is the decoupling.
Read that as a ladder. Cited beats uncited by roughly 120%. Cited still trails no-overview by 38%.
Ranking first on an AI query without a citation is the worst seat in the house. You paid for the position and the overview is answering with someone else’s page. On those queries the citation is the ranking, and everything you do on the page should be pointed at earning it.
Sort your queries into four piles
Search Console shows you the queries. It just won’t tell you which of them trigger an AI Overview, and the generative AI report gives you pages, not queries. So the list takes a little assembly.
- Pull the queries. In Search Console, open Performance and choose Search results, the regular report. Set the last three months, click the Queries tab, sort by impressions, and export the top 50. Those are the keywords that matter for this exercise.
- Find the pages the AI is already using. Now open the generative AI report, the one under Performance with only Pages, Countries, Devices, and Days tabs. It has no Queries tab, so use it for pages: note which ones got AI impressions, then look those pages up in the regular report to see their queries. Those are the ones most likely to be showing an overview.
- Check each query. Search it in a signed-out window and record two things: does an AI Overview appear, and is your site listed in its sources. Fifty queries takes about an hour.
- Or let a tracker do it. Most paid rank trackers now flag whether an AI Overview shows for a tracked keyword and whether your domain is cited in it, which turns the hour into a filter.
Then every query goes into one of four piles.
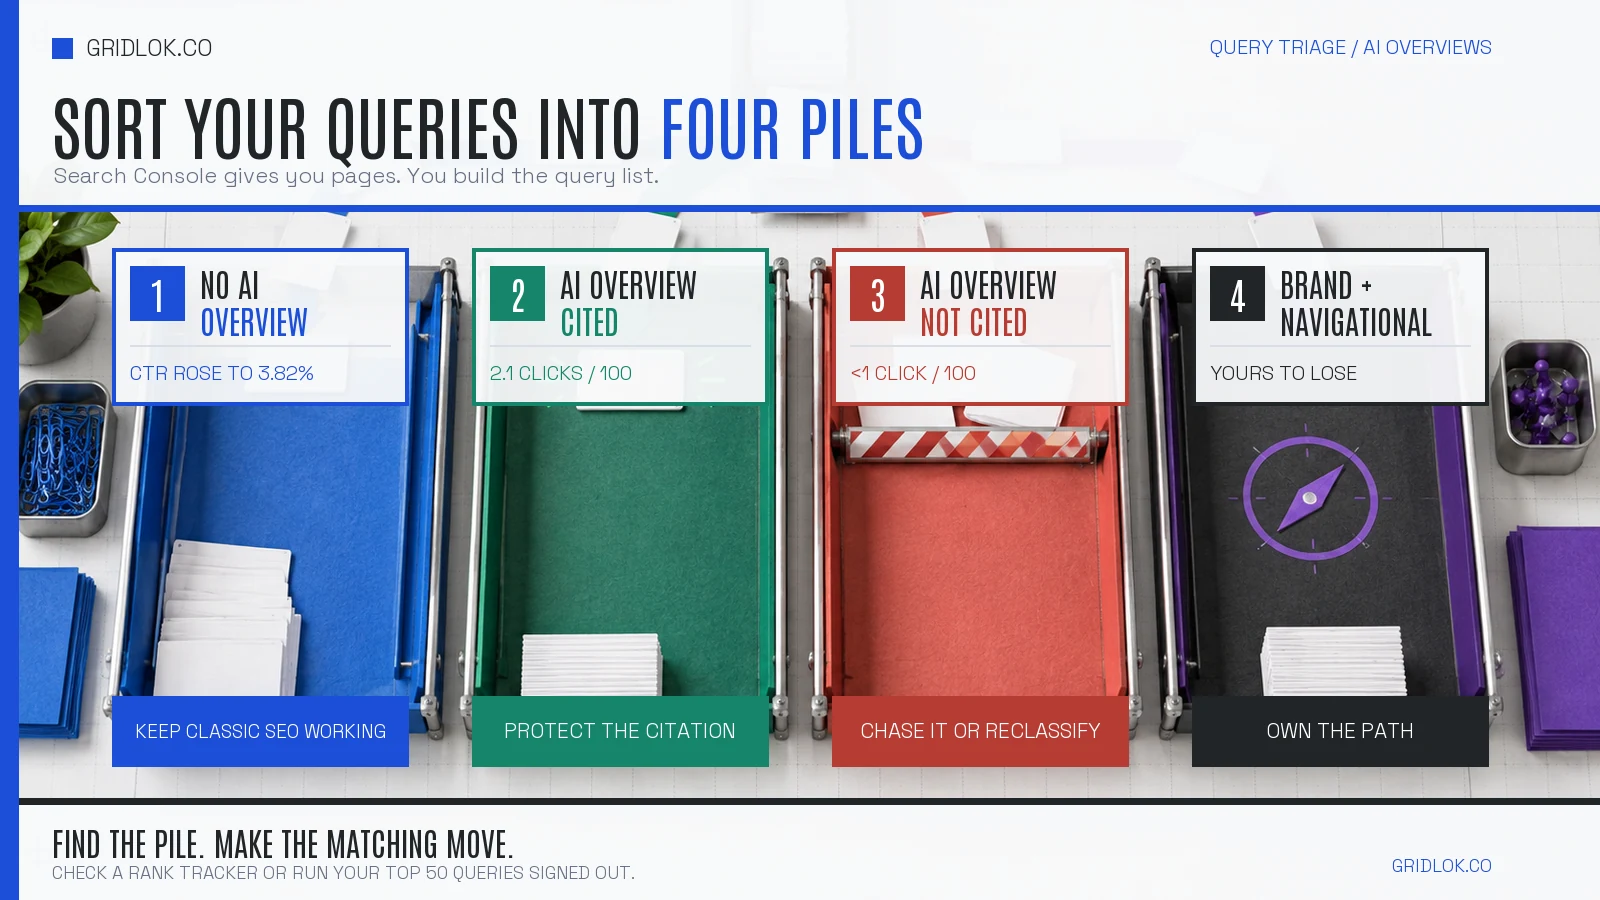
| Pile | What click-through did | Your move |
|---|---|---|
| 1. No AI Overview | Went up, to 3.82% in Seer’s set, because the results page got simpler | Classic work still pays: rank, write a title people want to click, keep the snippet tight. Change nothing that’s working. |
| 2. AI Overview, you’re cited | About 2.1 clicks per 100 impressions | Protect it. Keep the passage the model lifted where it is, keep the page dated and updated, keep the author and date in your schema. Losing a citation costs more than losing a position. |
| 3. AI Overview, you’re not cited | Under 1 click per 100 impressions. This is where the decoupling lives | Chase the citation with the changes in the next section, or accept the page is now an awareness asset and stop grading it on clicks. Leaving it in the traffic report and feeling bad every month is the one option that doesn’t work. |
| 4. Brand and navigational | Yours to lose | The reader already knows you. Make sure Google’s own surfaces don’t sit between you and them. Preferred Sources belongs here, and I’ll get to it. |
If you’d rather check citations directly, this walkthrough covers how to see whether AI is citing your site across Google, ChatGPT, and Perplexity.
What gets a page cited
The pages that get pulled into overviews share a shape, and it’s not mysterious.
- A heading phrased the way the question gets asked. The model matches the query to the section before it reads a word of it.
- The answer in the first paragraph under it. Two or three sentences that stand on their own, then the detail.
- Something specific in that paragraph. A number, a date, or a named source. General claims don’t get lifted.
- Who wrote it and when. On the page and in the schema, so the citation has a name and a date attached.
- Text in the HTML the server sends. The crawlers that fetch pages for AI answers mostly don’t run scripts, so anything JavaScript adds later is invisible to them.
- Those crawlers allowed in. OpenAI’s search crawler is a different user agent from its training crawler, and it’s easy to block both without meaning to.
None of that is exotic. It’s the same structure that earned featured snippets for a decade, with provenance bolted on.
I went deeper on the schema and entity side in the post on getting cited as a service business. The checker below scores a page on exactly these signals, so you don’t have to eyeball it.
The two levers Google handed you
Google built two controls that bear directly on this problem, and both get ignored because neither one is a ranking trick.
The first is Preferred Sources. A signed-in reader picks your site in their Google settings. From then on they see more of you in Top Stories, and your pages can be pulled into their AI Mode and AI Overviews.
It works one reader at a time, which sounds small until you notice it’s the only mechanism in AI search where the reader decides instead of the model. Google publishes a link that opens the setting with your domain already filled in.
I wrote up why you can’t optimize for Preferred Sources when it launched, and there’s a free button generator that builds the link and the badge code for your domain. Put it next to your follow links and in your newsletter. It’s the pile-four fix.
The second is the snippet controls. Google’s AI features documentation says that to limit what shows from your pages in Search, you use nosnippet, data-nosnippet, max-snippet, or noindex. It offers no way to stay in regular results while opting out of AI Overviews, so this is a blunt instrument.
Wrapping the paragraph that gives the whole answer away in a data-nosnippet tag keeps it out of the overview and out of your regular snippet at the same time. On a pile-three page that’s earning nothing anyway, that’s an experiment I’d run for a month and measure. On a page that’s cited, I’d leave it alone.
Change what a click is for
If each visit is rarer, each visit has to do more.
That sounds like a slogan until you look at what the average informational page asks of a visitor, which is nothing. They read, they leave, and the only thing you got was a session count that a summary now takes from you.
The pages that hold up are the ones with a job after the click:
- A tool the summary can’t run.
- Original data the summary can only quote, with the full table on your page.
- A comparison that needs the reader’s inputs.
- An email capture that turns one visit into a channel Google doesn’t sit in the middle of.
Google keeps saying the clicks that survive are quality clicks. Fine. Then measure them that way: conversions and signups per click, not clicks.
If the quality claim is true for your site, that number rises while sessions fall, and you’ll be the one holding the data Google never published.
And fix the dashboard. Annotate May 13, 2025, September 12, 2025, April 3, 2026, and August 31, 2026.
Use the generative AI report as your visibility line and your analytics as your click line. Stop comparing year-over-year impressions across the bug window, because those comparisons put a broken meter next to a fixed one.
What this doesn’t fix
A commodity informational page, the “what is X” post with nothing in it a hundred other pages don’t have, isn’t coming back. The overview answers it and nobody needs you for it. The fix there is to stop making them, which is cheaper than any of the above.
AI Mode is growing, and its click-out rate is worse than an overview’s. The Datos data also says a rising share of the clicks that do leave the results page land on Maps, YouTube, and Shopping. Where one of those surfaces carries your category, being on it is now part of organic, whether or not that’s the search we signed up for.
And all of the click-through figures above are desktop or panel data. Mobile, where most searches happen, is measured less and probably worse.
FAQ
The chart that scared everyone in 2025 was part AI and part broken meter. The AI part is real, it’s concentrated on queries you can list, and on those queries the citation is the ranking now. Sort the piles, earn the citation where it’s earnable, and give the clicks you keep a job.
Sources
- Seer Interactive, AIO Impact on Google CTR: 2026 Update, April 2026. 53 brands, 5.47 million queries, January 2025 to February 2026.
- Pew Research Center, Google users are less likely to click on links when an AI summary appears in the results, July 2025.
- Ahrefs, Update: AI Overviews Reduce Clicks by 58%, December 2025 data, 300,000 keywords.
- Google Search Console Help, Data anomalies in Search Console, entries for April 3, 2026 and August 13 to 17, 2026.
- Google Search Central, Introducing Search Generative AI performance reports in Search Console, June 2026.
- Brodie Clark, Were We Wrong About “The Great Decoupling” After All?, September 2025, on the num=100 change and bot impressions.
- Liz Reid, Google, AI in Search is driving more queries and higher quality clicks, August 2025.
- Google Search Central, AI features and your website, on snippet controls and AI Overviews.
- Darwin Santos, the post on X that named the Great Decoupling, May 31, 2025.
- Barry Schwartz, Search Engine Roundtable, The Great Decoupling Of Clicks & Impressions From Google Search, June 3, 2025.
- Barry Schwartz, Search Engine Roundtable, Google Explains The Great Decoupling, June 18, 2025, on Martin Splitt’s remarks at Search Central Live Warsaw, June 16, 2025.
See what ChatGPT is really searching
SubSeed captures the hidden Google queries ChatGPT runs behind every answer and enriches them with search volume, CPC, and keyword difficulty.
Related Posts

Read this post with an assistant
This is the whole prompt each button sends. Nothing hidden in it.
Read https://gridlok.co/blog/great-decoupling-impressions-up-clicks-down/ and give me the main points in a few sentences.
Make Gridlok a Preferred Source on Google
See Gridlok surfaced more often in your Top Stories, AI Overviews, and AI Mode. One click, applied across Google Search.