What Is a Saliency Map? (With Real Examples From Apple’s Homepage)
A saliency map is a picture of where a person’s eye is most likely to land on an image or a screen. Warm areas mark what pulls attention first. Cool areas mark what tends to get passed over.
The name comes out of vision research and sounds more technical than the idea underneath it. Saliency is the reason your eye jumps to one thing before you have consciously decided to look at anything.
Key takeaways
- A saliency map predicts where attention concentrates on a screen, driven by features like contrast, color, edges, and faces.
- It’s a model’s prediction, trained on recorded eye-tracking data, rather than a recording of any real visitor’s gaze.
- Saliency is reflexive and bottom-up, so the map knows nothing about what a visitor arrived wanting to do.
- On a real page it works as a fast check on whether your layout points the eye at the thing you care about.
What is a saliency map?
A saliency map takes an image and returns a second image of the same shape, where the value at every point is how strongly that spot is predicted to draw the eye. Rendered in color, high values look warm and low values look cool, which is where the familiar heatmap appearance comes from.
The prediction describes people in general. It estimates the pattern you would get by showing the same screen to many viewers and pooling where their eyes went, rather than what one particular person will do.
Vision researchers split looking into two parts. Bottom-up attention is the reflex, the pull that happens in the first fraction of a second before intent arrives. Top-down attention is goal-driven, the deliberate hunting you do when you want a price or a phone number. A saliency map models the first one.
That distinction sounds academic until you try to act on a map. Everything a saliency map is good at, and everything it gets wrong, traces back to the fact that it only sees the screen and never sees the visitor.
What makes something salient
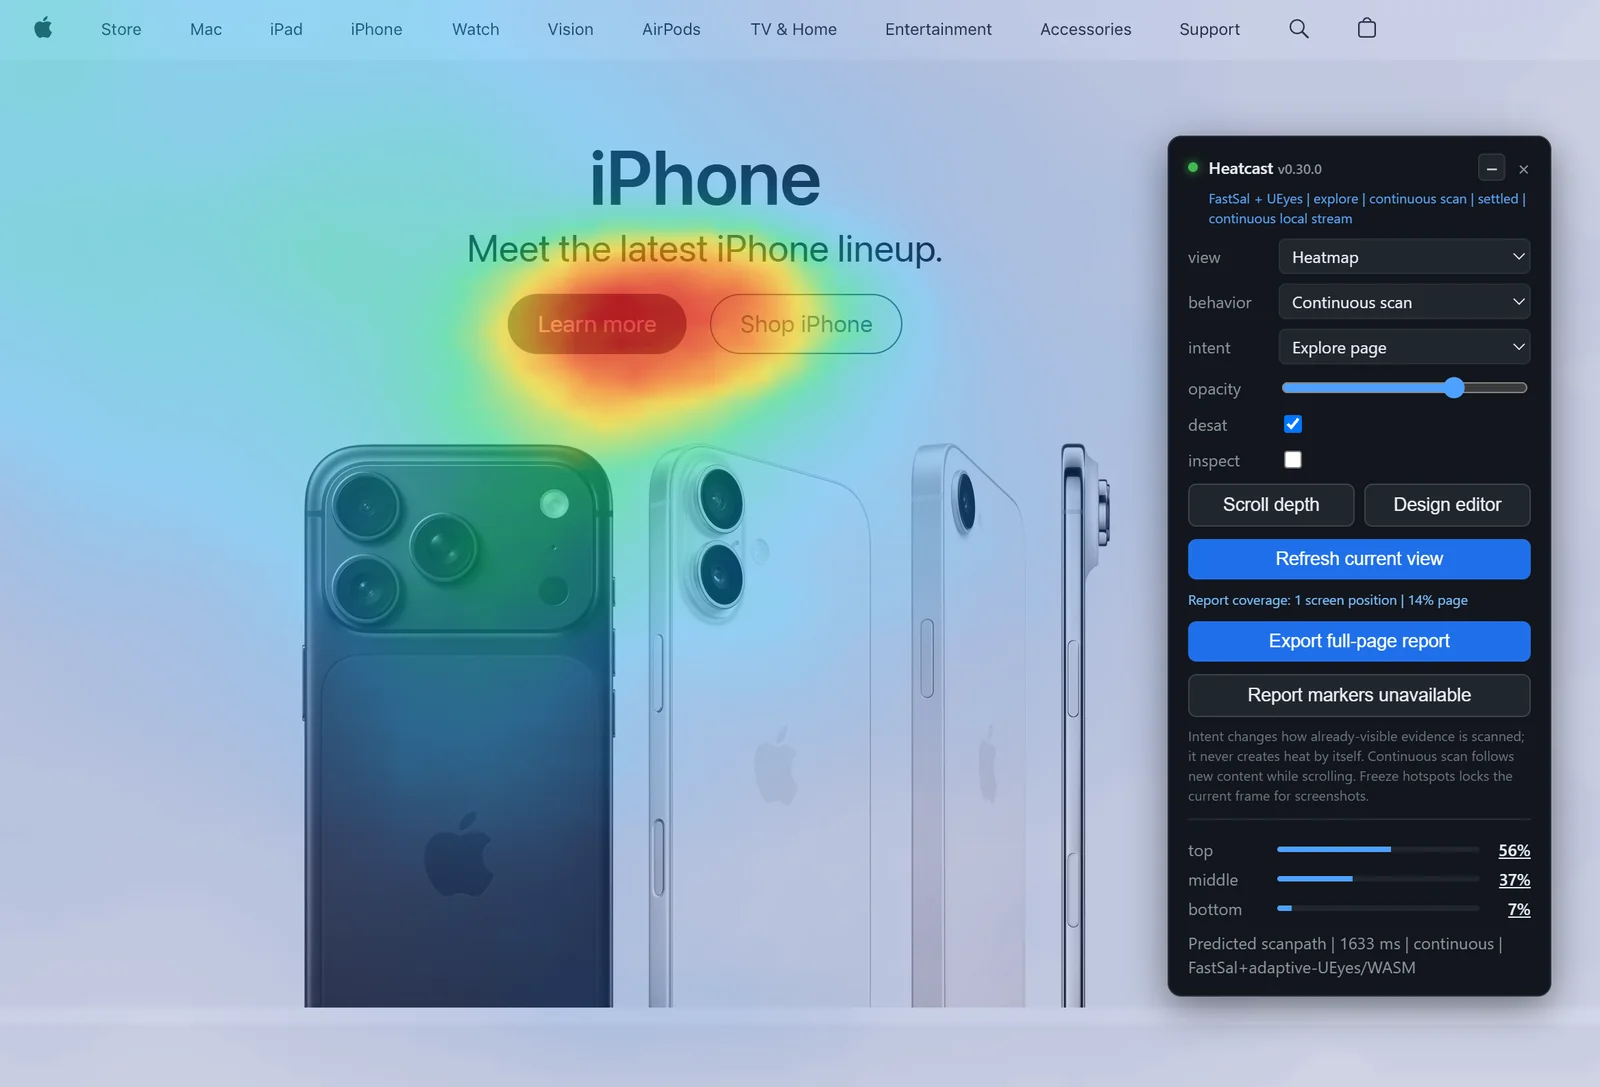
Four features do most of the work. I ran the tool across Apple’s homepage to show each one, partly because the design is deliberate enough that the model and the designers mostly agree, which makes the disagreements easier to spot.
Contrast against the background
The strongest single driver is local contrast, meaning how much a region differs from what surrounds it. A bright element on a dark field and a dark element on a bright field both win attention for the same reason.
This is why a button with a solid fill beats an outlined one sitting right next to it, at identical size and position. The fill creates a hard contrast edge and the outline mostly doesn’t.

Color and saturation
A saturated color inside a muted palette behaves like a flare. The eye is drawn to the outlier, so the effect depends entirely on the surroundings rather than on the color itself. Orange on a page of grays is loud, and orange on a page of oranges is wallpaper.
This one catches people out, because a colorful product image can quietly outcompete the copy that was supposed to carry the page.
Faces
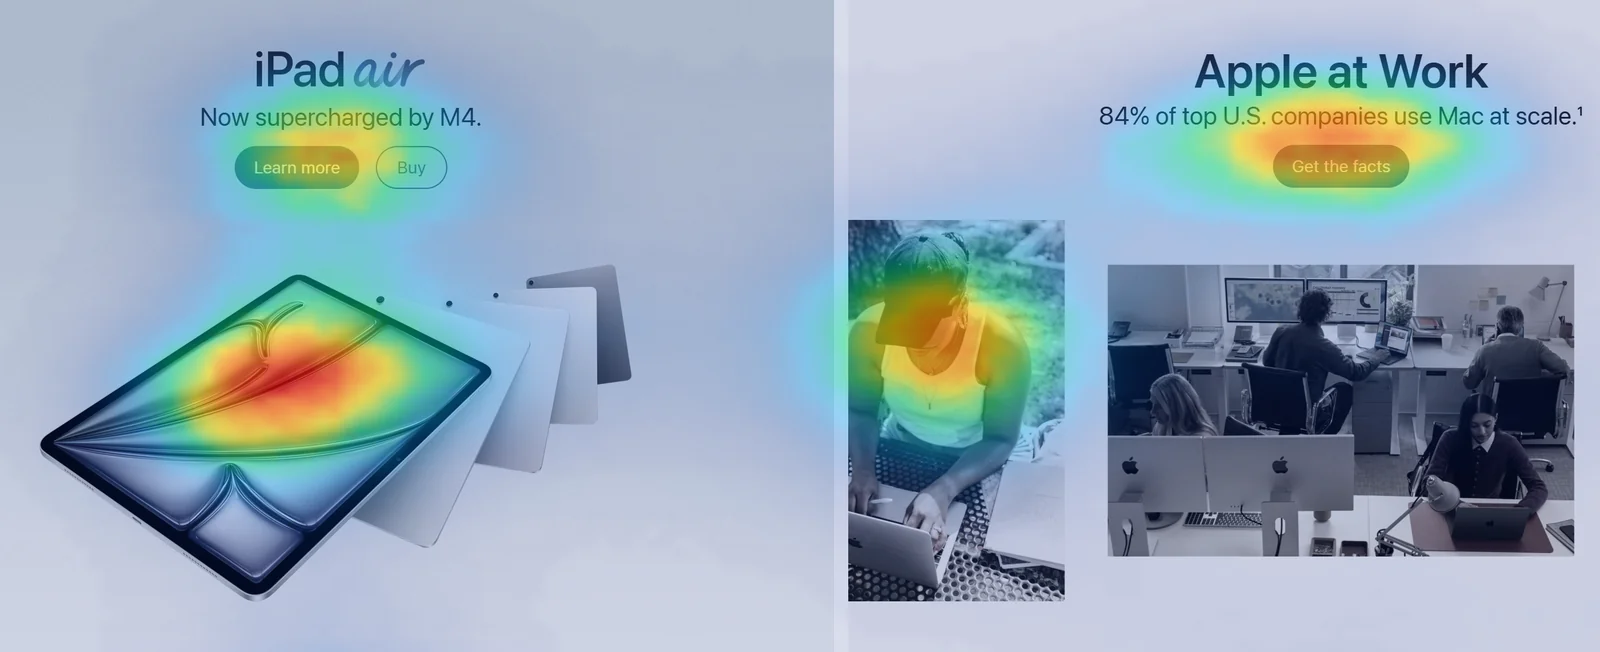
Faces draw early attention more reliably than almost anything else on a screen, and the effect survives a lot of visual competition. It holds even when the face is small, partly obscured, or one of several.
So putting a person on a page is a real choice. Their face will pull the eye, and everything next to it gets less.
Isolation and size
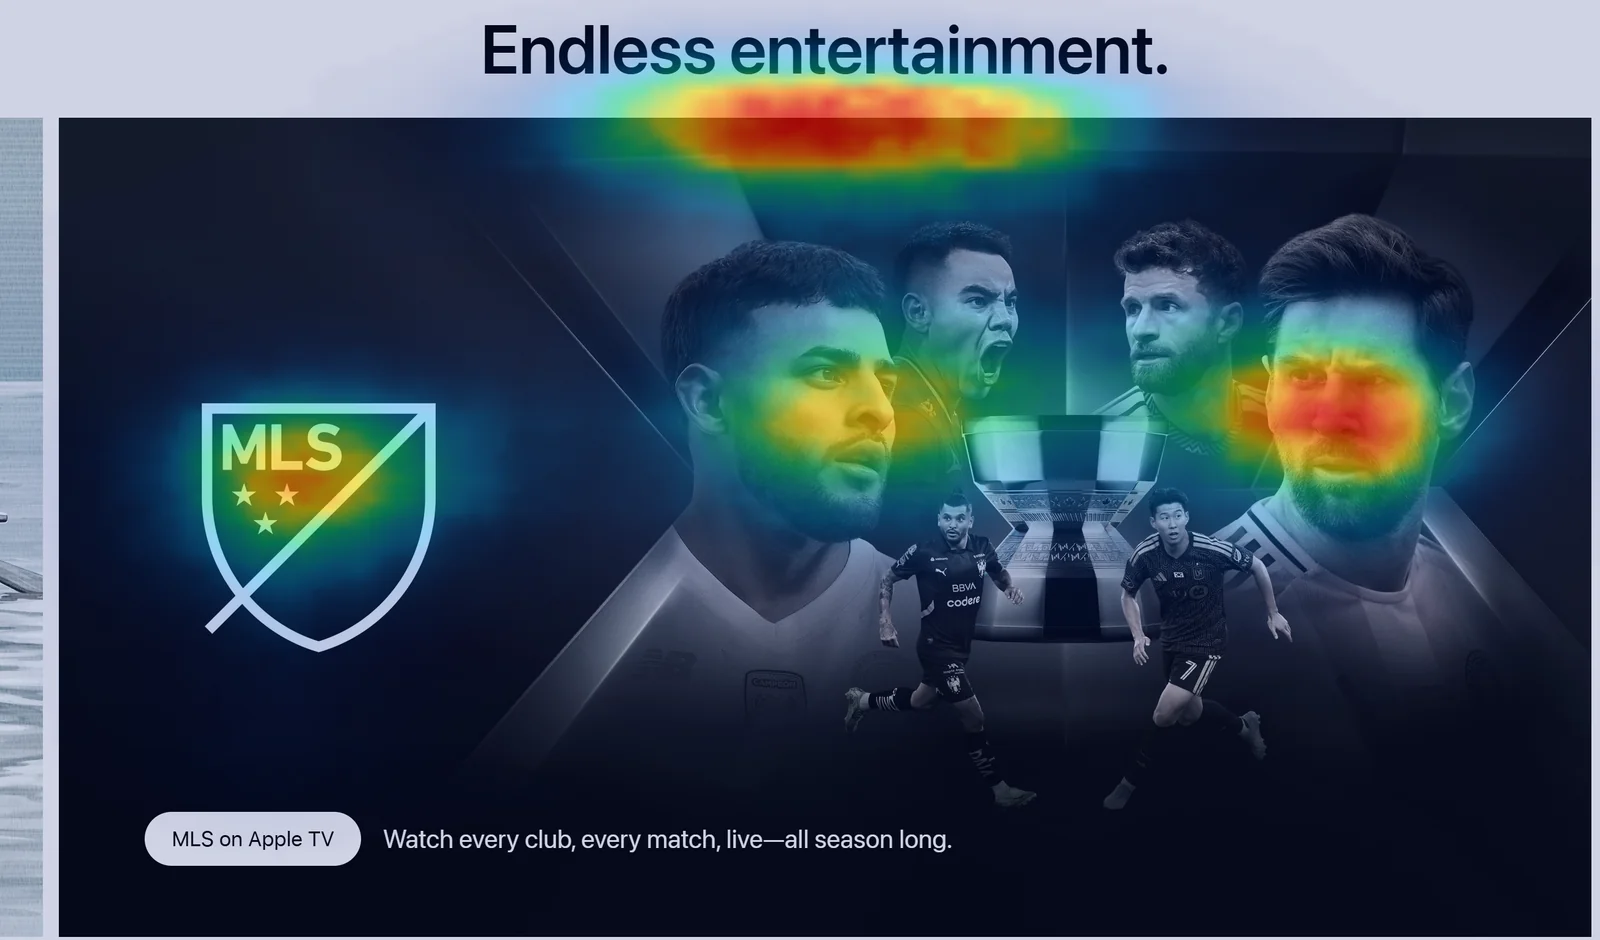
An element with space around it reads as separate, and separate things get looked at. Size helps, though less than most people assume once an element is past a certain threshold.
A row of four equally weighted items is the common failure here. Nothing is isolated, so nothing wins, and the eye takes whichever one position happens to favor.
Where saliency maps come from
The maps aren’t hand-authored rules. A model is trained on datasets where researchers recorded real people’s gaze with eye-tracking hardware, showing each viewer a set of images and logging exactly where their eyes landed and for how long.
Pool enough of those recordings for one image and you get a fixation map, a picture of where attention concentrated across many viewers. Train a model on thousands of image and fixation-map pairs and it learns the relationship well enough to estimate a map for a screen it has never seen.
One wrinkle matters for web work. Most saliency models were trained on natural photographs, and people look at interfaces differently than they look at scenery, driven by text blocks, buttons, and layout structure. Correcting for that takes eye-tracking data collected on actual interfaces, which is what a dataset like UEyes provides.
How a saliency map differs from a heatmap and from eye tracking
These three get used interchangeably and they aren’t the same thing.
Eye tracking is measurement. Hardware records where a real person’s gaze actually went. It’s the ground truth everything else is built on, and it needs equipment and participants.
A website heatmap, the kind most analytics tools sell, is a record of mouse behavior rather than eye behavior. Clicks, cursor movement, scroll depth. It needs live traffic on a page you own, and it tells you what visitors did with their hands.
A saliency map is a prediction of where eyes would go, produced from the pixels alone. No hardware, no participants, no traffic. That’s the tradeoff: it reaches pages the other two can’t, and it’s an estimate rather than a measurement, the same instinct behind refusing to guess how your customers behave applied one step before the data exists.
What a saliency map can’t do
It doesn’t know intent. Someone hunting for a return policy scans a page differently than someone browsing, and the model sees the same pixels either way. Learned behavior sits outside it too, which is why a saliency map will happily put a hotspot on a banner ad that experienced users have trained themselves to skip.
It also says nothing about persuasion. A map can tell you the headline gets seen. Whether the headline earns the next thirty seconds is a separate question, and no heatmap of any kind answers it.
And it predicts an aggregate. Your specific visitors, arriving from a specific ad with a specific expectation, are a narrower group than the general population the model learned from.
Running one on your own page
The useful question to bring to a saliency map is narrow. Find the one element the page exists to communicate, then check whether the map agrees that it stands out. If your offer is cool and a decorative image is hot, the layout is spending attention on the wrong thing. There’s a fuller set of questions in how to read an attention heatmap, including why the order matters more than the heat.
Where this connects to the rest of what I write here is hierarchy. A page where the eye finds the main point quickly is usually a page with one dominant heading, an answer near the top, and sections that separate cleanly, and those are the same properties that let a machine reader extract and quote your content. That’s the throughline of AEO being mostly SEO with new acronyms and of getting cited by AI. A saliency map is a usability check that happens to overlap with what machine readers reward, and I wouldn’t oversell it past that.
If you want to see one on a page you care about, Heatcast runs this model stack locally in your browser, so the page never leaves your machine.
FAQ
A saliency map answers one narrow question well. On this screen, what does the eye go to first? Hold it to that question and it’s a genuinely useful second opinion on a layout. Ask it about intent, persuasion or rankings and it has nothing to offer.
Sources
- Hu and McGuinness, “FastSal: a Computationally Efficient Network for Visual Saliency Prediction” (2020), on efficient saliency prediction. arxiv.org/abs/2008.11151
- Jiang et al., “UEyes: Understanding Visual Saliency across User Interface Types,” CHI 2023, on why interfaces need different calibration than natural images. github.com/YueJiang-nj/UEyes-CHI2023
- SALICON, a large-scale saliency dataset built from crowd-collected attention data, on how these models are trained. salicon.net
- MIT/Tübingen Saliency Benchmark, on how saliency models are scored against held-out human eye-tracking data. saliency.tuebingen.ai
See what ChatGPT is really searching
SubSeed captures the hidden Google queries ChatGPT runs behind every answer and enriches them with search volume, CPC, and keyword difficulty.
Related Posts
Read this post with an assistant
This is the whole prompt each button sends. Nothing hidden in it.
Read https://gridlok.co/blog/what-is-a-saliency-map/ and give me the main points in a few sentences.
Make Gridlok a Preferred Source on Google
See Gridlok surfaced more often in your Top Stories, AI Overviews, and AI Mode. One click, applied across Google Search.